When it comes to gaining valuable insights from research, collecting user data is easy. You can create and send out a survey in minutes and schedule user interviews while you’re at it. The real challenge lies in organizing research data and drawing insights that achieve your research objectives.
As you collect data, themes and patterns emerge. The quick and easy road is to look at the emerging trends and conclude based on gut feelings. But personal feelings in research lead to biased recommendations that do not achieve your research goals.
Data synthesis often happens alongside data analysis, where you break down individual parts of a problem to understand the situation better. The best analysis leads to high-level insight alongside a roadmap for implementation. Moreover, these key insights are reliable because they are based on objective evidence, not bias.
So, how do you turn raw, bulky data into the valuable insight you need?
In this guide, I’ll explain:
- What is data synthesis and why it’s important
- Why you should analyze your research data
- What makes a good insight
- The common issues with data synthesis
- How to analyze and synthesize data for the best insights
What Is Data Synthesis, and Why Does It Matter?
Data synthesis combines multiple data sources into a single source of truth to understand the commonalities between individual data points.
Think of synthesis like a puzzle. Each data point you collect is a separate piece of the puzzle. Individually, they don’t make sense until you put them together to form a complete picture.
UX research synthesis allows you to gain insights and make recommendations for product teams to act on. The ability to turn research into action makes data valuable.
What’s in a Good Research Insight?
Michael Morgan, the Senior User Experience Researcher at Bloomberg, shares some characteristics of a good insight:
1. Grounded in Real Data
Just as lawyers gather the evidence before arguing their case before a jury, UX researchers must ensure that the data collected is based on what you observed. Conclude from what you see, not what you feel. However, intuition is not a bad thing when the interpretation of accurate data inspires it.
2. Features Simple Language
Not all stakeholders are researchers. If you want stakeholder buy-in, use language that’s easy for anyone to understand. Using a casual tone and simple language makes your research insight more effective. Also, you can’t present every insight at once, or you’ll overwhelm your audience. Instead, communicate each insight as a standalone point to have more impact.
3. Findings that Speak to the Audience
A compelling insight moves your audience to action. It answers pertinent questions from project stakeholders that shape your primary research goals. In addition, the insight changes the mindset of the product team about the research topic. Some stakeholders may even quote sentences from your research when they find it compelling. You know your research is memorable when stakeholders are quoting insights verbatim.
4. Actionable key points
The purpose of your insight isn’t only to report findings but to inspire action. If the product and design teams can’t act on your recommendations, there’s still work to be done.
5. Action owners
As a user researcher, how do you communicate critical insights to UX designers, product teams, and other stakeholders in a way that leads to action on your recommendations?
Based on the endowment effect, humans prefer objects they own to those they don’t. Ownership and commitment are the main ingredients of great insight. When stakeholders own insights, there’s a greater chance they’ll follow through with solutions and action.
Common Issues With Synthesizing UX Research Data
Dense Information
Dense information makes it difficult to separate useful information from redundant information. Hence, you’re unable to make a decision and may fall into the trap of regurgitating research data as insight without analysis.
Analyzing dense data requires self-discipline, collaboration skills, and prioritizing the right information.
Large Volume of Data
It’s time-consuming reading a ton of transcripts and field notes from user research. In addition, a large volume of data makes it challenging to find patterns and remember what’s important.
I always advise user researchers to upload and organize research data as soon as you collect them. When you organize qualitative research after each session, it’s easier to focus on one data set at a time instead of analyzing everything at once.
Unclear Goals for UX Research
Without setting clear goals for research, it’s easy to get carried away as you start collecting data. Since there’s no structure, the resulting insight isn’t what stakeholders want to see.
When you lose focus with UX research, find the overlap between your research and what you should be exploring. Otherwise, you may have to repeat the UX research process.
Contradictory Findings
Contradictory findings are a common occurrence in UX research. For example, people may say one thing but exhibit different behavior when you monitor them. That’s because humans may not always know what they want, even if they believe they do.
You may experience difficulty interpreting participant feedback because the feedback is contradictory. Contradictory findings give space for bias to influence decisions. As a result, you may unconsciously ignore feedback that doesn’t match your expectations, even when it’s correct.
The best way to approach contradictory findings is to analyze your data for complementary evidence rather than validatory points. That way, you are looking at data from a multi-dimensional view instead of expecting all participants to fit a single set of rules.
Should You Trust Your Gut When Conducting Research?
In the hours you spend asking questions, observing behavior, and listening to people, you unconsciously process and form impressions of what you see or hear. Gut feeling (or intuition) is the conclusion you draw from that exposure.
If you’re able to connect a comment with a pattern in other research data, it’s worth investigating further, right?
Well, yes, and no.
Your instinct is powerful. It points to problems and possible solutions even before you have conclusive data. But intuition is also prone to bias.
The best way to approach gut feelings is to analyze first, then follow your instinct. Your intuition becomes more reliable as you explore the information and gain exposure to different contexts. Your intuition should flow from data interpretation, not an assumption. Trust your gut but only when you can validate it with factual evidence.
How to Analyze and Synthesize UX Research Data
1. Share Inspiring Stories
Use stories to show your ideal persona using the product or fulfilling the goal of your research. The story should answer who, what and why questions of the situation.
Examples of stories to share include stories that:
- Surprised you
- Made you curious
- Verified or refuted your assumptions
Stories build empathy and inspire action. In addition, they give project stakeholders a better understanding of your users’ needs.
According to the Harvard Business Review, stories cause the brain to release oxytocin, a feel-good chemical associated with empathy and the desire to cooperate.
A few tips to remember when telling user stories include:
- Make your story relatable to your audience
- Put the reader in the scene with descriptive details
- Tell a story that applies to the research topic
2. Define Your Point of View
A point of view (also called user need statement) is an actionable problem statement that explains the user’s genuine need.
For example, a point of view (POV) states that the user’s need is to digest information, not spend hours on a clunky dashboard. Articulating the need for easily digested information helps product designers build an intuitive dashboard that improves user experience.
Like user stories, POV should follow the Who-What-Why rule. To create your point of view, aim to uncover the core needs of your audience as it relates to your research topic. However, the POV is not a solution nor an indication of how you’ll satisfy user needs.
3. Frame POV With How Might We Questions
Reframing insight statements as questions provides a framework to brainstorm solutions around your audience’s needs. In addition, how might we (HMW) questions lead to ideation sessions where you explore ideas to solve design challenges innovatively.
Start by framing your POV as several questions by adding “how might we” at the beginning. For example, using our previous POV example, you may come up with the following HMW questions:
- How might we give users access to all the information they need?
- How might we present that information in a way that’s easy to digest?
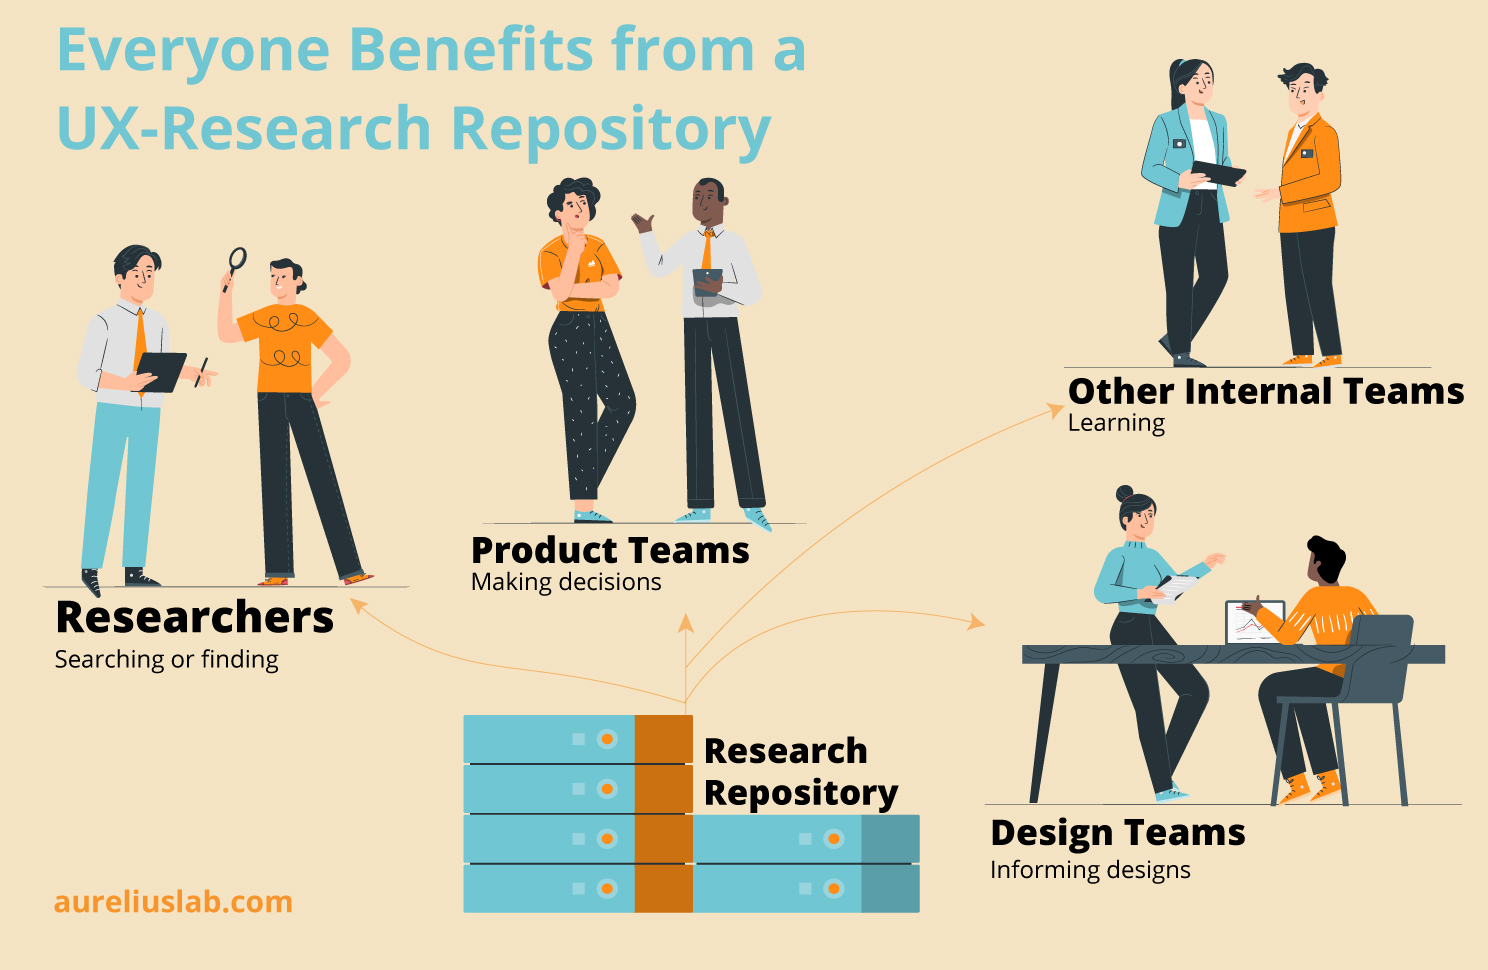
4. Use a UX Research Repository
A user research repository is a central storehouse for UX research data. Instead of keeping data in multiple places, you store and organize your research data in a way that is easily searchable and reusable in the future.
The ease of organization and findability is a crucial feature of a research repository. It means you can apply past insight to future research, which speeds up the UX research process.
Here are a few tips to make the best use of a UX research repository:
- Appoint a “library” or repository owner – A specific person should be in charge of running your research repository. If you have an in-house research department, they should handle the research repository.
- Create an organizational system for your research projects – Have a structure for organizing research data, so it’s easy to find.
- Add labels to notes, observations, and feedback – Label the data as you collect it in real-time. As a result, you speed up your analysis and build your research library simultaneously.
- Develop Insights, nuggets, and findings – Record what you’ve learned from the research. Explain the context. Use tags and supporting data to help your audience understand your research.
- Group, search and share your Insights – Grouping insights provides a system to quickly search and share relevant user research insights with stakeholders.
5. Run Brainstorming Sessions
There’s a common misconception that UX researchers should do all the work independently. The truth is that analysis and data synthesis is a group effort. When you feel stuck, reach out to the product and design team. Run a brainstorming session to get a diverse perspective. Use how might we questions to inspire creativity.
The stakeholders in the brainstorming session should be experts in the research topic or have some background with the subject.
6. Document Interviews
Documentation is the starting point of a successful data synthesis. Document observations, body language interpretations, recurring patterns, and verbatim quotes that stand out during user interviews. It’s also good practice to take photos and record audio and video of interviews for future reference.
7. Collect and Organize Data
Qualitative research quickly becomes chaos when you have data all over the place. So, the first step in the analysis is to collect research data and organize them in an easily accessible way. Creating a system for managing files makes it easier to reference and analyze.
Digital organization is the best way to organize files. Use Aurelius to transcribe videos, clips, highlight reels, audio, and hand-written files into digital format. Then, store them under projects with file names like session dates, participant’s name, or any category that works for you. At the end of each usability or interview session, store all files relating to the research in the correct project file.
Without a research taxonomy, it’s easy to miss essential information during synthesis. Instead, organize data by tags, notes, and naming conventions so everything is easy to access.
Here are some steps you can take to organize your data:
- Invest in a user research repository tool – Notepads and spreadsheets require lots of manual brainpower. It’s easy to miss critical points and difficult to find information when you need it. On the other hand, UX repository tools like Aurelius are specially designed for storing and analyzing user research data.
- Take research notes – Jot down important observations during user research sessions to find common themes for organizing data.
- Organize with tags – Tag common themes to sort data by trends and patterns. UX research tools like Aurelius use artificial intelligence to automatically find themes and tags in your notes without human help.
- Use consistent file names – Consistent file names makes it easier to find data.
8. Consider a UX Research Taxonomy
Data is helpful beyond the scope of a single research project. UX research taxonomies are a robust tag structure for naming and classifying information within a research repository.
Here are some rules to build an effective UX research taxonomy:
- Tag your research correctly
- Create taxonomies based on departments, teams, user challenges, goals, product features, user persona, and more
- Add relevant tags to your observations to reference each observation with different research scenarios
9. Refer Back to Your Research Goals
Your research goals should guide the analysis process and help you choose useful information. For example, let’s assume you’re designing an illustration toolkit for professional illustrators. Your research goal is to understand the features they want most. By referring back to your goal, you’ll focus on data that explains how your users prefer to create illustrations and what design technique they use the most.
10. Create User Personas
A persona is a fictional representation of an audience group. User personas help you understand the goals, needs, and challenges of your target audience(s).
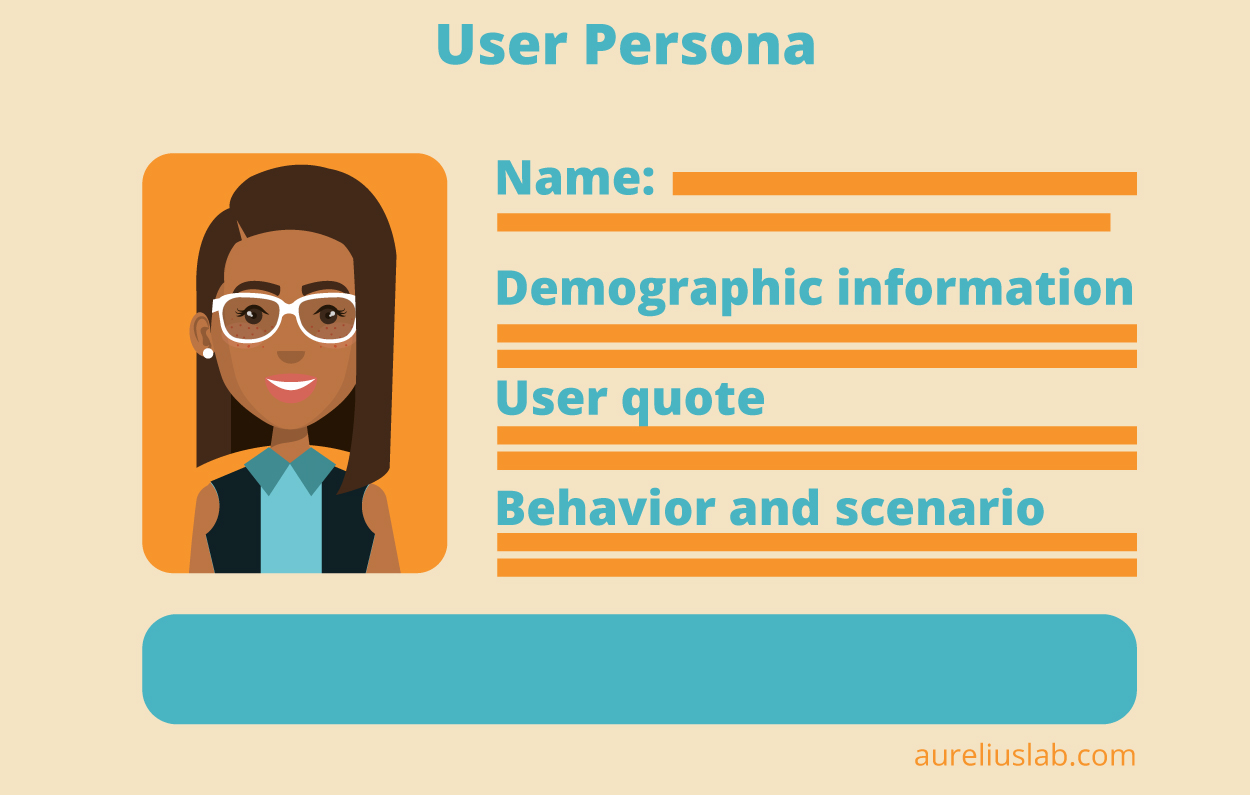
While personas are fictional, the core qualities are based on research participants you’ve interviewed. The details you add to the personas depend on essential product features. Generally, a user persona contains:
- A name
- Face
- Demographic information
- User quote
- Behavior and scenario
11. Map User Journeys
User journeys describe the typical situations and tasks users encounter. It also explains the paths they take to accomplish those tasks. User journey illustrates a preferred approach for completing a task and can serve as reference points during design. It can also help you justify decisions to stakeholders by showing the before and after of using your product or solution as part of the user journey.
To create a user journey:
- Choose a project scope to focus on
- Define the user persona for the user journey
- Determine expectations and scenarios for your user
- Create a list of touchpoints (points of product-user interaction) and the channels associated with them
- Sketch the journey
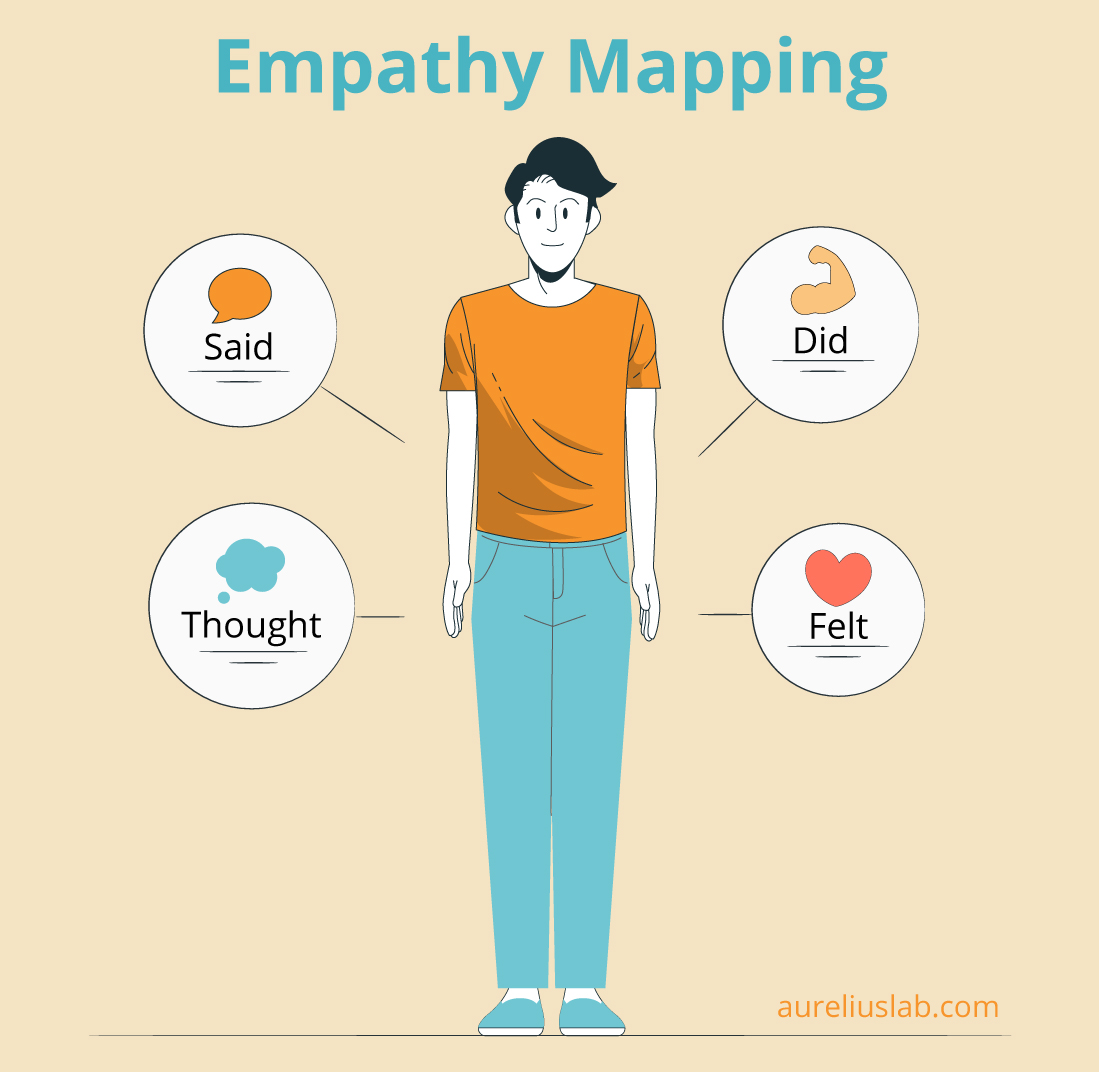
12. Use an Empathy Map to Understand the User’s Needs
An empathy map helps you gain a deeper understanding of the user’s needs. It is how you synthesize your observations from research data to draw insight into your user’s needs.
There are four quadrants in an empathy map:
- What the user said
- What the user did
- What the user thought
- What the user felt during the research session
You create your map by recording each user interaction in its relevant quadrant.
13. Look for Patterns With Affinity Diagrams
Affinity diagrams help you organize large amounts of data into groups of similar items to find connections between them quickly.
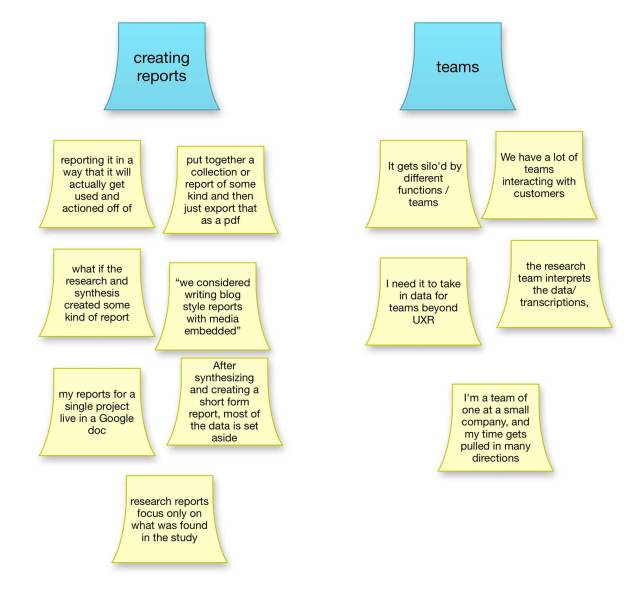
Source: Aurelius Lab
Take the following steps to create an affinity diagram:
- Record all notes on individual cards
- Look for related patterns in your data
- Create a group for each pattern and name them
- Add a key insight describing what you learned from each group
14. Synthesize Data
During synthesis, you combine results from all your research data to form a fundamental understanding of the topic. You’re looking for connections that highlight ideas and potential solutions to problems. These are patterns that help you develop gut feelings or draw conclusions.
Use tags to highlight repeatable patterns. Then, describe the insight from themes with key insights. You can quickly achieve this goal with Aurelius.
Tags in Aurelius help you identify patterns across research data such as questions, pain points, and goals. First, you can visualize data as charts to view the most recurring tags in a project. Next, you can form key insights from your tags and notes.
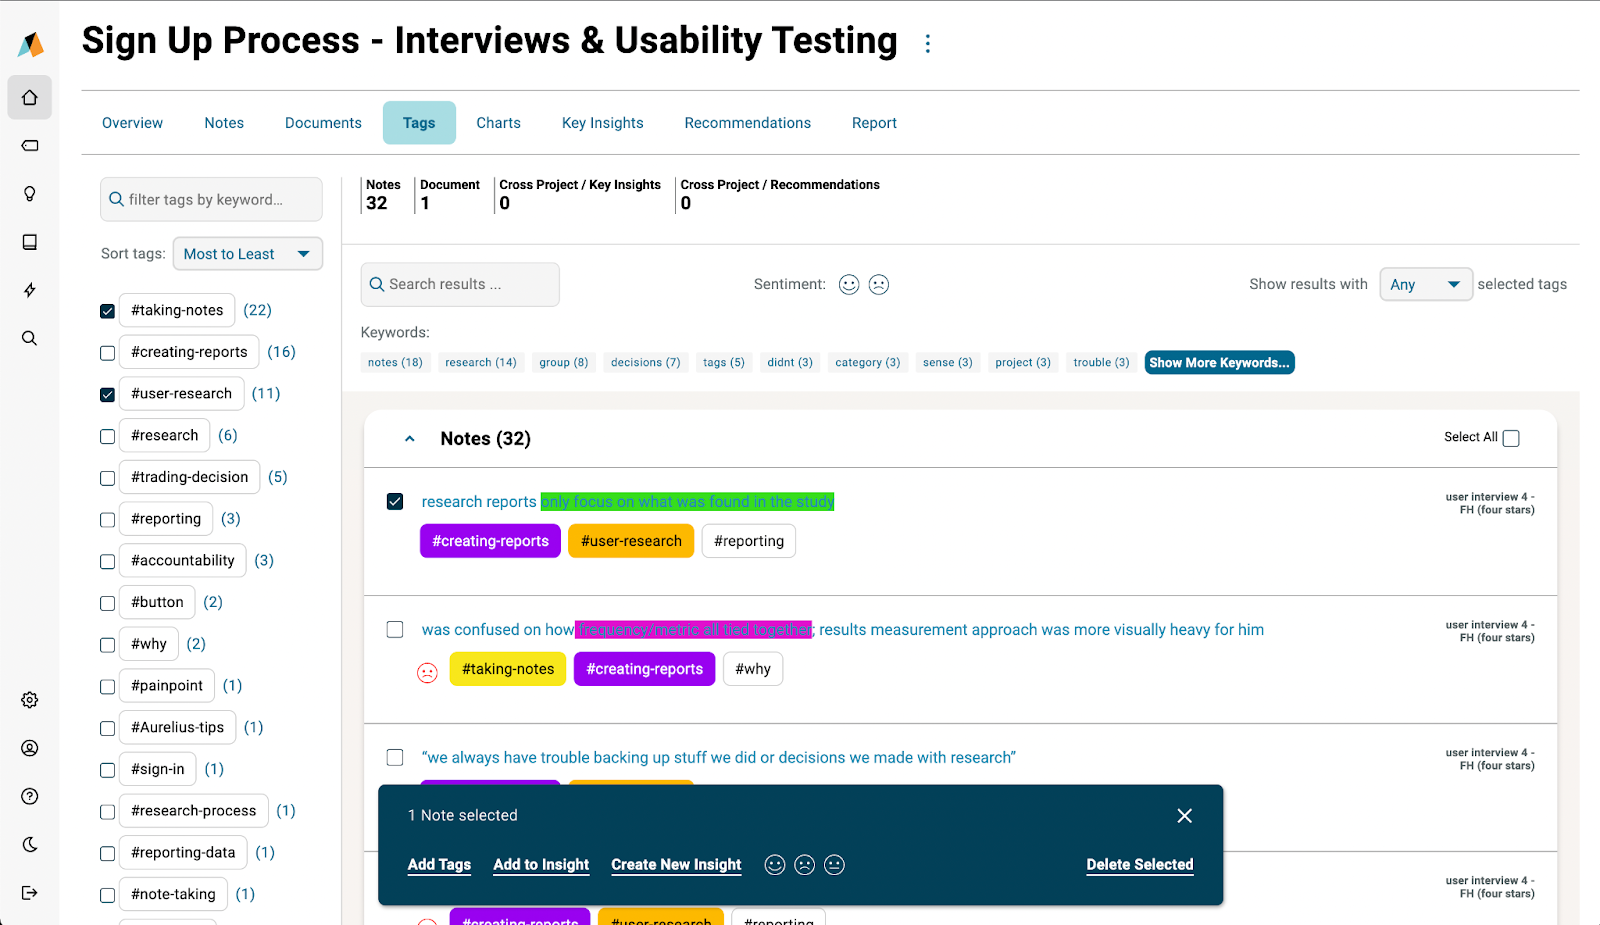
A few ways to use Aurelius for Key Insights include:
- Highlight text from research notes
- Draw insight from past and current project
- Use a tag to describe the insight
- Add supporting evidence such as highlight reels, documents, notes, video and audio clips to the Key Insight
- Group insight by various formats such as design, feature, product, or create a custom type in Aurelius
- Create insights from the Notes, Tags, Reports, and Key Insights Pages
Further reading
Learn how Aurelius improves UX research synthesis for product and design teams
15. Share Your Research Findings
There are many options for sharing and presenting UX research findings. A few options include:
- Use the automatic report builder in Aurelius to turn insights and recommendations into editable UX reports. You can share these reports as a live link or via PDF
- Slack
- Case studies
- Whitepapers
However, it’s not enough to send emails, PDFs, or links. Decision-makers are busy, and their attention span is short. Instead, use your company’s internal knowledge base to reach stakeholders where they hang out. Send follow-up emails and reach out personally to the executives if you want them to implement your research.
Research Is Meaningless Without Meaningful Insight
Collecting data is only the first step in research. Without analyzing and synthesizing research data, there’s no way to validate hypotheses or uncover insights that achieve your research goals.
The most valuable insights come from a genuine desire to understand your user and provide value. That desire takes the focus away from product features and reporting on facts to understanding user goals and generating meaningful insights.
Learn how Aurelius helps you turn research data into actionable insights